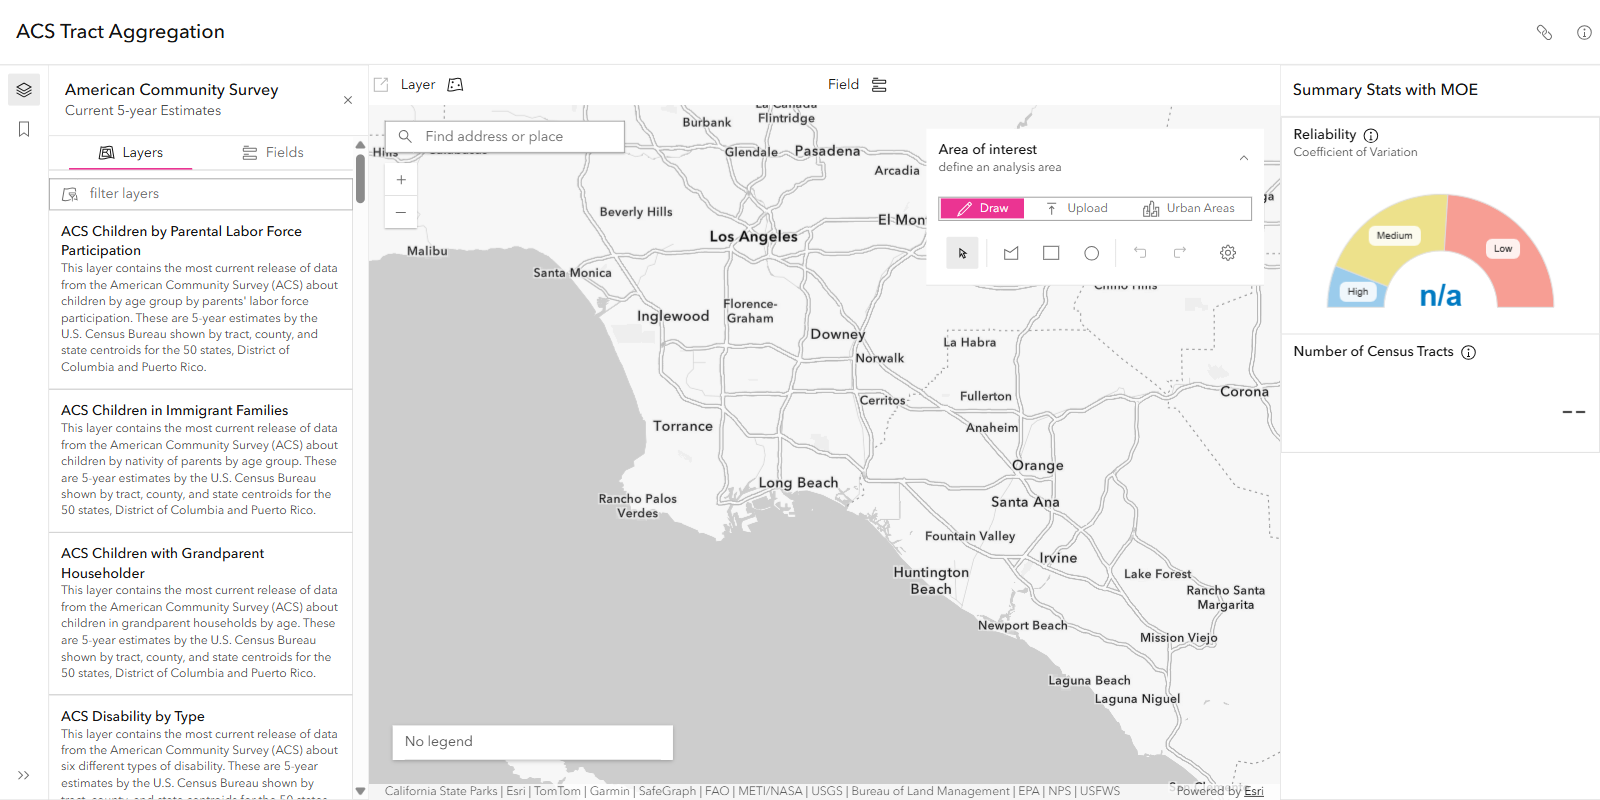
ACS Tract Aggregation helps people see how reliable American Community Survey (ACS) numbers are. ACS data is a survey, so every estimate has a margin of error, and small areas such as single census tracts can be noisy. Combining tracts gives a more reliable estimate, and this app shows that happening.
I rebuilt the app in React on the ArcGIS Maps SDK for JavaScript and updated its underlying data. It is a demo for Esri’s Living Atlas team, built to highlight Living Atlas content and show what you can do with the ACS data.
What I Changed
- React rebuild with better state management: the app’s state (selected layer and field, area of interest, results) is now handled in React, so the map, layer list and reliability gauge stay in sync as the user changes things.
- More symbology options: added different ways to symbolize the ACS layers.
- National vs. in-view symbology: used the SDK’s smart mapping to render values either against the national distribution or against only what is in the current map view.
- Summaries for uploaded polygons: users can upload their own area and see the aggregated estimate, margin of error and CV for it.
- Urban Areas: users can pick an urban area as the area of interest instead of drawing one.
How It Works
- Choose an ACS layer and a statistics field.
- Draw an area of interest, upload one, or pick an urban area.
- The app aggregates the tracts in that area and reports the estimate, its margin of error, and a Coefficient of Variation (CV) gauge rated low, medium or high.
As more tracts are combined, the margin of error and the CV go down, so the gauge shows when an aggregated number is reliable enough to use.
How to Use the App
- Open ACS Tract Aggregation and choose an ACS layer from the layer list on the left.
- Pick the statistics field you want to evaluate, such as a population or income measure.
- Define your area of interest: draw one on the map, upload your own, or select an urban area.
- Read the results on the right: the aggregated estimate, its margin of error, and the CV gauge.
- Adjust the area, adding or removing tracts, and watch the gauge move from high toward low as reliability improves.
Technology
- ArcGIS Maps SDK for JavaScript: the map, the area-of-interest tools and smart mapping for symbology.
- React: application structure and UI.
- ArcGIS Living Atlas: the ACS layers the app reads from.
About the GeoXC Labs
This app is hosted on Esri’s labs site alongside the other demos. See the GeoXC Labs Gallery for more.