Assignment Outline
-
Create your own ArcGIS Pro project in the right directory.
-
Add Survey123 Feature Service to ArcGIS Map.
-
Add Definition Query to Feature Service to get your data.
-
Create three new Features and copy your Feature Service Data into the right vector object type.
- Points to Point File
- Create New Line Data from line data.
- Create Polygon using polygon data.
-
Show examples of other data file types and convert to at least two other data formats.
-
Add one additional data source to your map from somewhere else as reference material.
-
Stylize your data.
-
Create a new layout.
- Add a title
- Add other map reference material to your map.
- North Arrow
- Scale Bar
- Refernce Coordinate System
Deliverables
- Export map and share on discussion board.
- Take screen shot of your file directory.
Extra Credit
- Add labels!
- Add your photos!
1) Create your ArcGIS Pro Project
Open ArcGIS Pro and Save Project
First, open up ArcGIS Pro.
Select “Start without a template”.
Save the file to the file directory where you feel comfortable and name the project something that is meaningful, but not too long. Consider when you have 15 projects you manage or in the event you go back to this project to made an edit in a year.
Add the Correct Panes to your Project
In the Ribbon, click on View and click either the Catalog View or Catalog Pane, your choice.
Add the Map Pane
Two different options here:
In the Ribbon, click on Insert and select New Map.
Or, In the Catlog Pane/View, right click Maps and select New Map. Additionally, in this view, you can enter the Maps folder, and see all the maps that you have created thus far in your ArcGIS Pro Project. You can rename each of these to keep track of what you are doing in a project.
Add our Data
We are going to load our data now to the map.
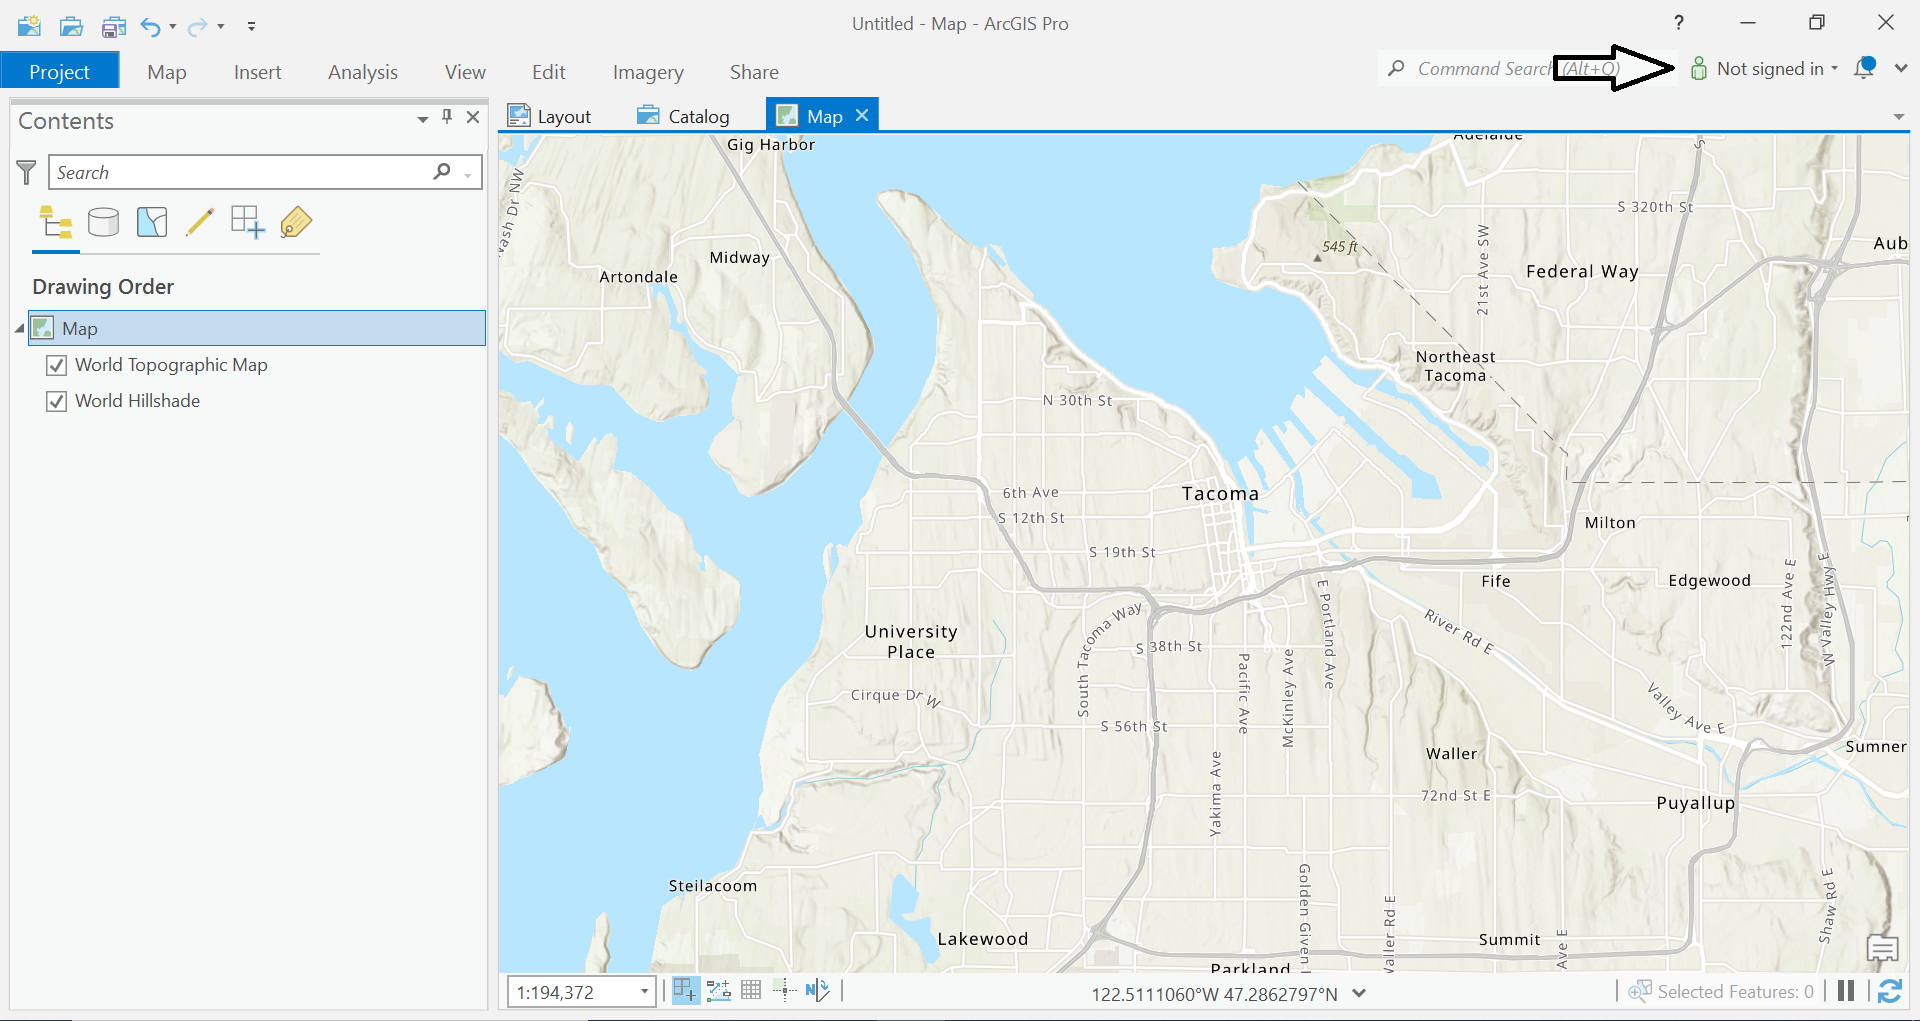
Our Survey123 data was connected to our ArcGIS Online Account. To make sure we are able to connect to our data, in the upper-right hand portion of the window make sure that you are signed into ArcGIS Online.
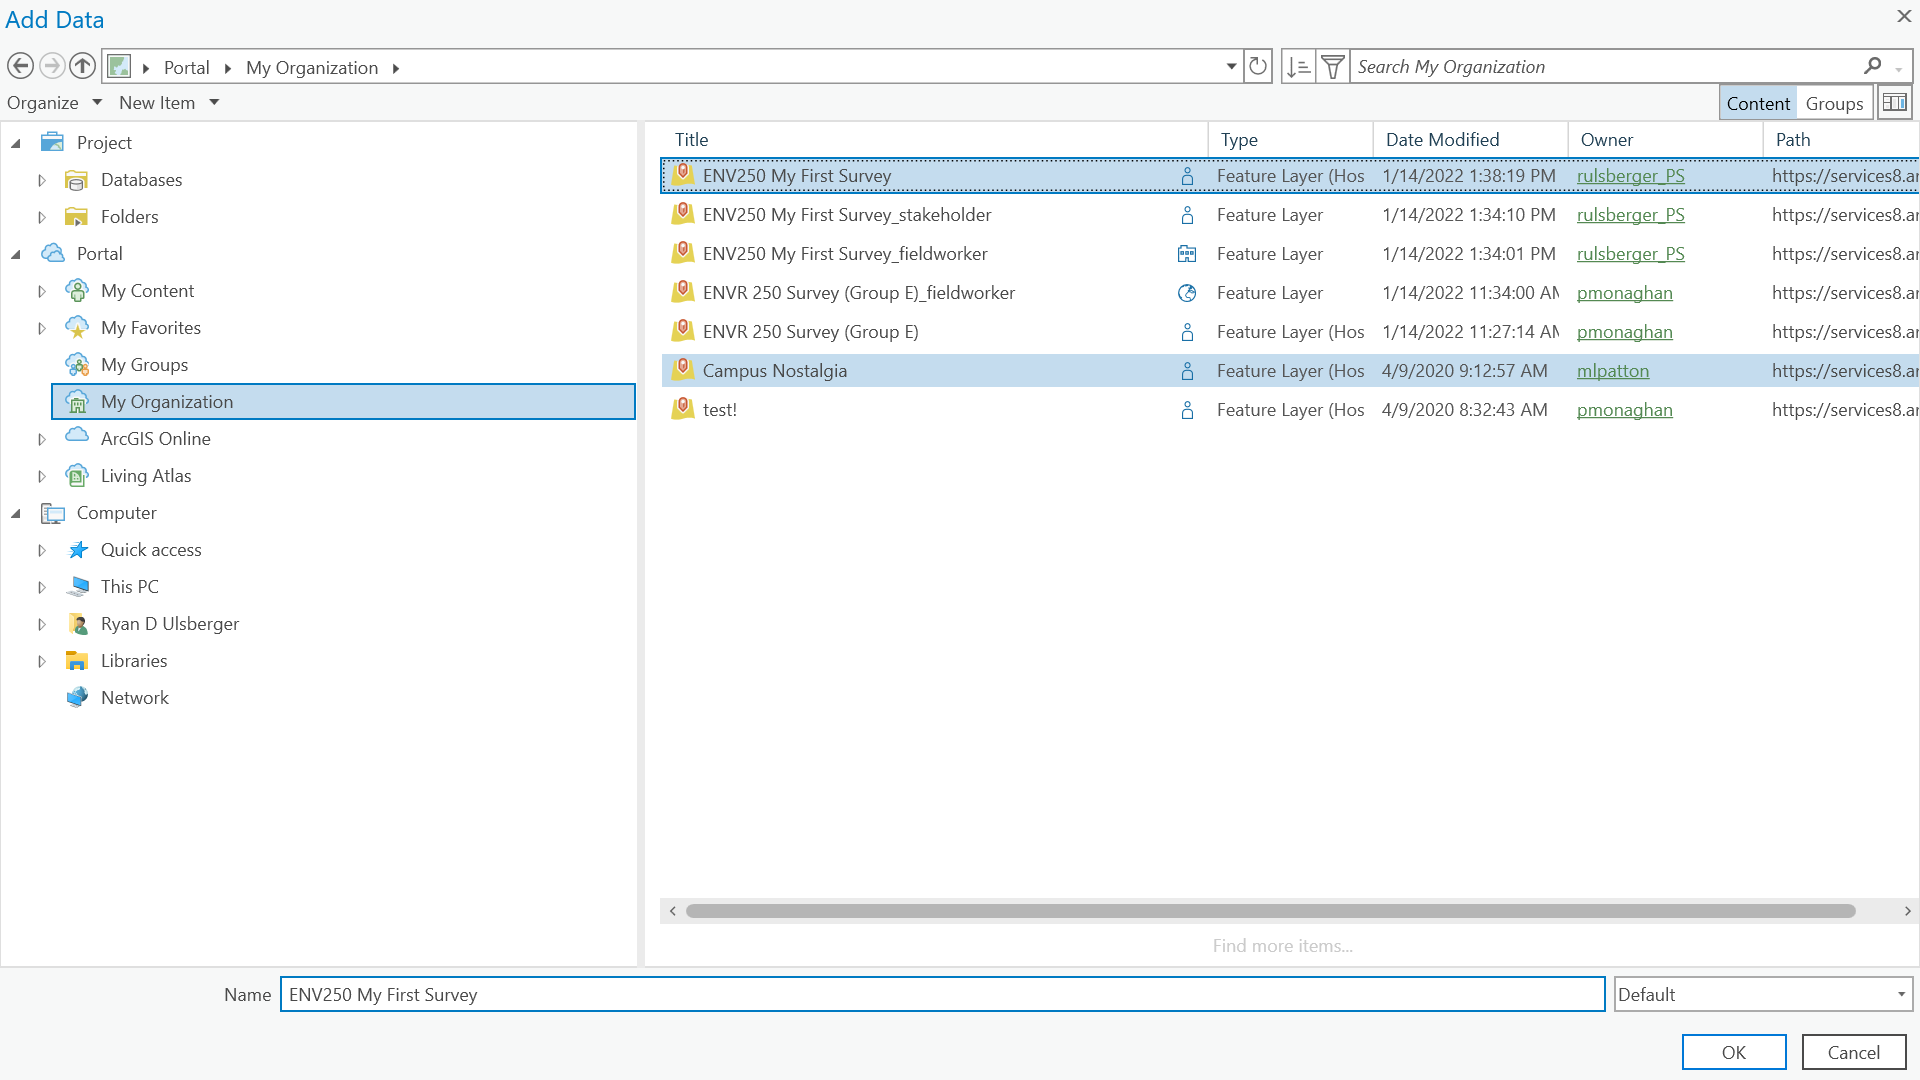
Go to your Map View. In the Ribbon, go to the Map tab > Layer Section > Add Data
ArcGIS Pro will now recognize the data stored in your AGOL account and you should be able to navigate and find it there.
Under the Portal, click the My Organization, and select ENV 250 My First Survey.
Explore the Data
Like we did in class, explore your classmates’ data a bit.
Look at the Attribute Table, use the Map View to explore where people have galavanted.
Your Data
After you have taken some time to check out the data, let’s dive into filtering your data out of the group’s. We are going to make a copy of this data in our own File Geodatabase.
However, let’s get our data first by creating a selection of our data.
Selecting
Try using the following methods to get to your data.
Select By Attribute
Open the Attibute Table.
In the header of the Attibute Table there will be a Selection: Select By Attibutes.
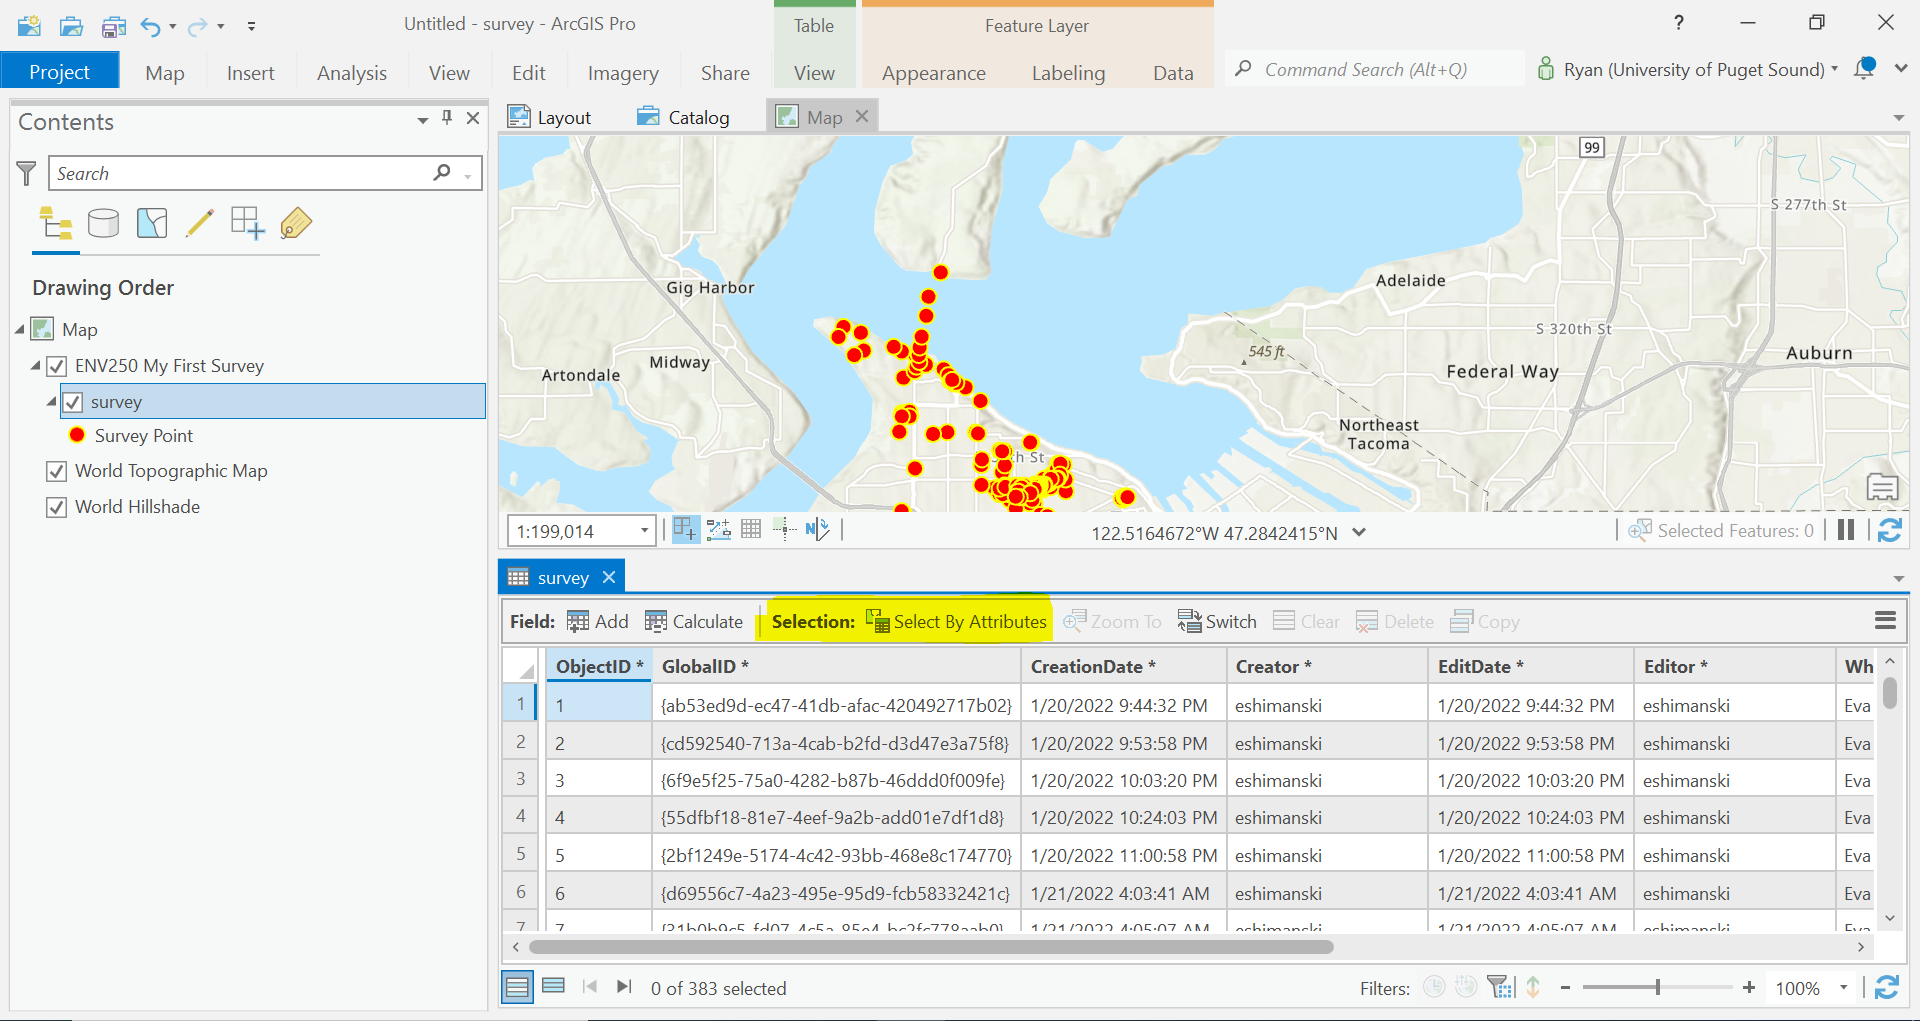
We are going to do a new selection. In the Where clause, choose a field to select the data that you created. Try the “Who” Column.
In your Attribute Table, the selected rows should be highlighted. In the bottom part of this window there are also two table like icons. These will allow you to show only the selected items, or the entire dataset.
Are you able to get all your data? Is your data clean and easy to query?
Select By Location
Additionally, you can select data using your cursor in the Map View. Go to the Map Tab in the Ribbon and there will be a selection section.
Click the Select Button. You can now draw on the map to select features. They should change color to show they are selected.
If you open the Attibute Table you will also see these items highlighted again.
Show Only Your Data
Finally, we can apply a query to our dataset on the layer level so we don’t have to fiddle with other people’s data at all.
There are again two different methods to complete this task.
First. Once you click on the layer in your Content Pane in the Map View, different options should show in the Ribbon based on what type of item you have clicked. In the case of a feature layer, there should options for:
- Appearance
- Labeling
- Data
We will only get into the Data tab for now, so click that Tab. There will be a section for Definition Query.
There should be "
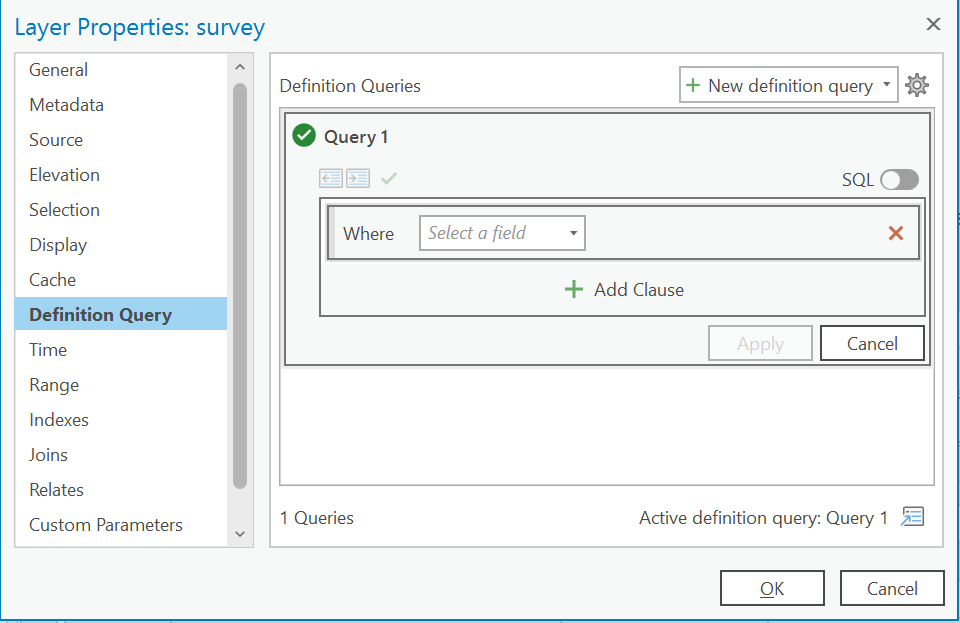
This will open the Layer Properties Window with an option to add New Defintion Query.
Alternatively, you can get to this same window by right clicking the layer in the Content Pane and going to Properties -> Definition Query.
Adding a new definition query is done similarly to selecting feature by attribute. Add the clause to get to your data.
Once selected, the data should only show your data on the map.
Export Data
This is actually new to me.
After we are done with our selection, we are going to export our data to the GeoDatabase.
Right click on the Survey123 layer in the Content Pane > Export > Feature Class.
A new window will open. And GUESS WHAT!!! Another option to write a selection query.
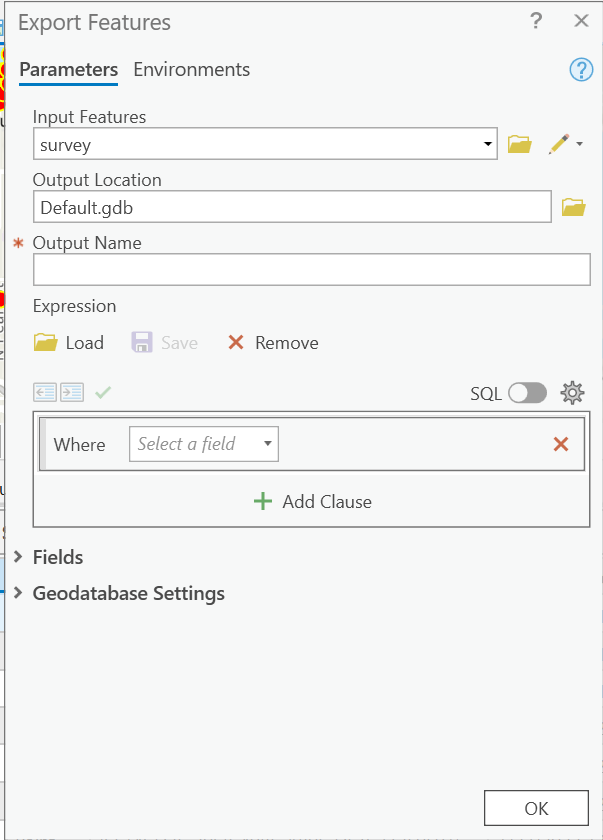
ArcGIS Pro creates a File Geodatabase for us in the project folder. Let’s put our data there. It is called Default.gdb.
Again, when naming our files, we want to have clear, consise names that make sense. Keep tidy. No spaces. It will save your life later. Clean name file example: ArtisanalCoffeeShopMap_020122.
If you have the Definition Query set you don’t have to apply any additional queries. It is running when the data is displayed and not during this Export step.
Click OK.
A new layer should be added to your Map Pane!
Creating Files in our File GeoDatabase
Open the Catalog Pane/View.
In the Databases section, there will be an item created called Default.gdb. This is the folder in our ArcGIS Project folder. If you open this folder in File Explorer, you will see a bunch of giberish. This is all the realational database tables which allow us to do magic.
If you open this now it should only have some data created that we just exported.
We are going to create a Feature Dataset first. A feature dataset is a tool which is a collection of related feature classes that share a common coordinate system. Since our data is all about where we did our survey, I think it’s relevant here.
Right click on the Default.gdb file, or in the blank workspace if you opened it up in Catalog. There will be a hover over, popup menu. Click New > Feature Dataset.
This will open a new Geoprocessing tab. Your output Geodatabase is Default.gdb. Give your Feature Dataset a good name. Remember, good naming conventions (no spaces, meaningful). Just stick to our Mercator Projection for now since this is simply a mapping exercise.
Hit Run.
Whew…
Our next agenda is to create three feature classes. Why Three?
Feature Classes only can store a single geometry type per layer. So we are going to create:
- PointOfInterest
- LineFeature
- PolygonFeature
You get the freedom to name your own Lines and Polygon Layers, but remember to give them meaningful names.
Right Click on your Feature Dataset and select New > Feature Class.
You will follow this six page dialog three times once for each type of feature layer we will create.
Lets start with our Point Layer.
Name: PointOfInterest
Alias: Point Of Interest
Select Point from the Feature Class Type.
For the Geometric Properties unclick both M and Z values.
Click Next.
On the Fields section (Page 2/6), click the Import button. This will open a File Exporer Window. navigate to your Default.gdb and select the name of the Survey123 Layer we exported.
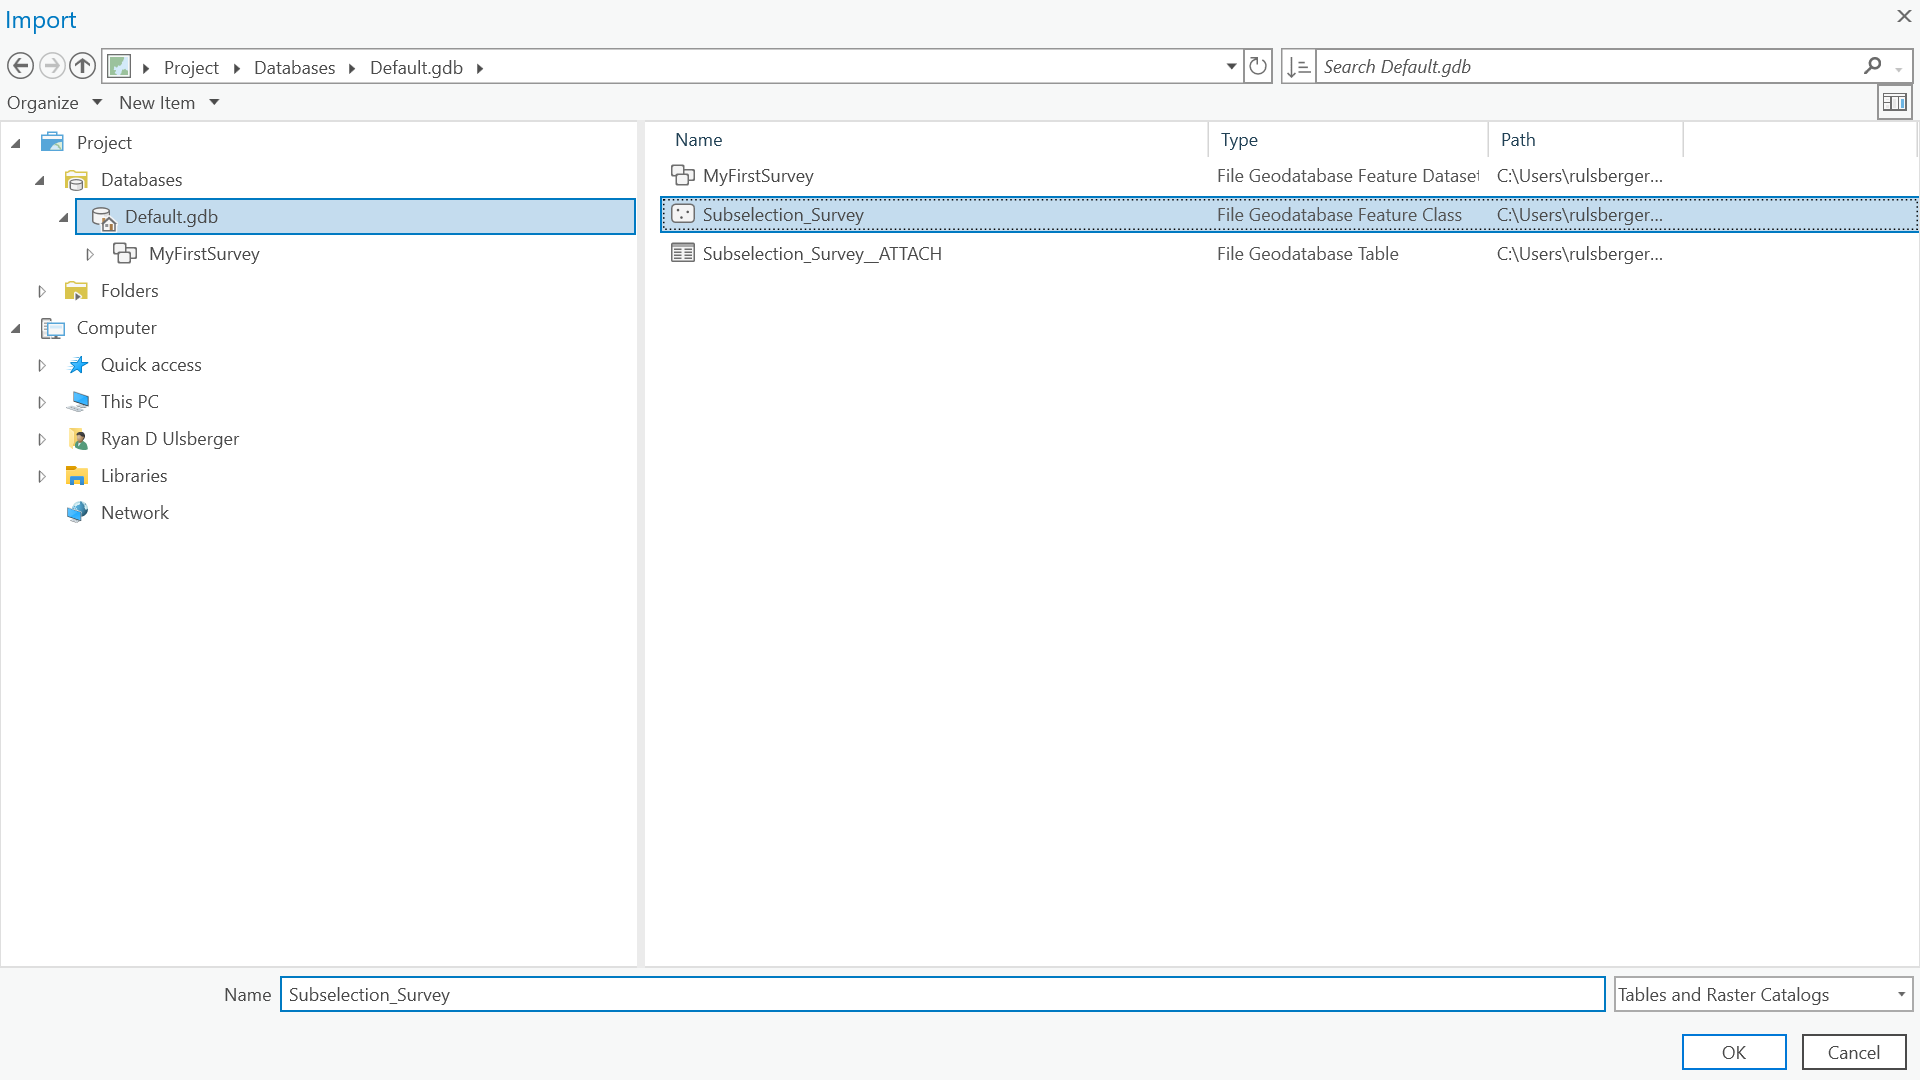
This will automatically make a new layer that is identical to the our Survey123 Layer. It should prepopulate all the fields.
Click through the table, delete the following:
- GlobalID
- CreationDate
- Creator
- EditDate
- Editor
Double Click the untitled_question_6. Rename this to when.
Accept the Defaults for steps 3 thru 6. Each of these are letting you specifiy details about the geometry properties. These are already set becasue we set a projection for the Features Dataset.
Click Finish.
A new layer with your Point Layer name should be added to your Geodatabase.
Repeat this step for a Line and Polygon Feature Layer. This time, manually create the fields that you would like to capture from your data that you collected.
Make sure you add the correct data type for each field.
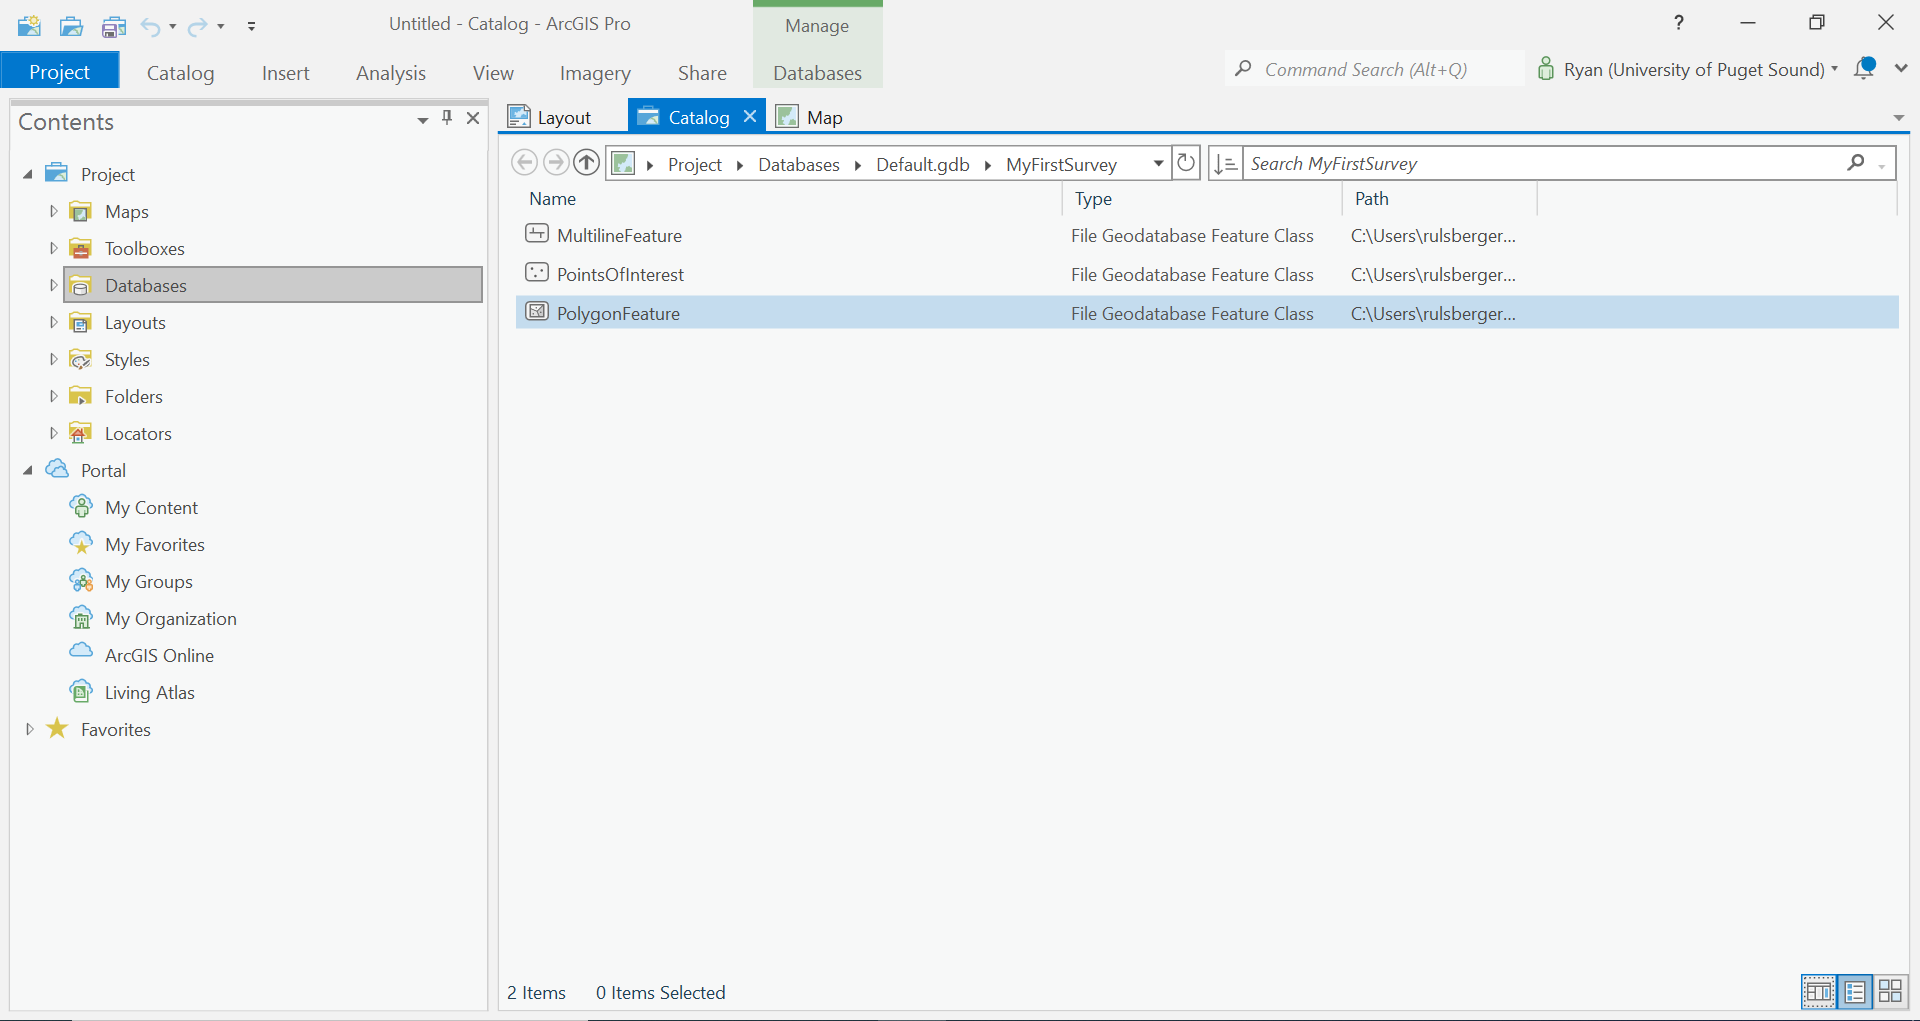
This is what your FeatureDataset should look like.
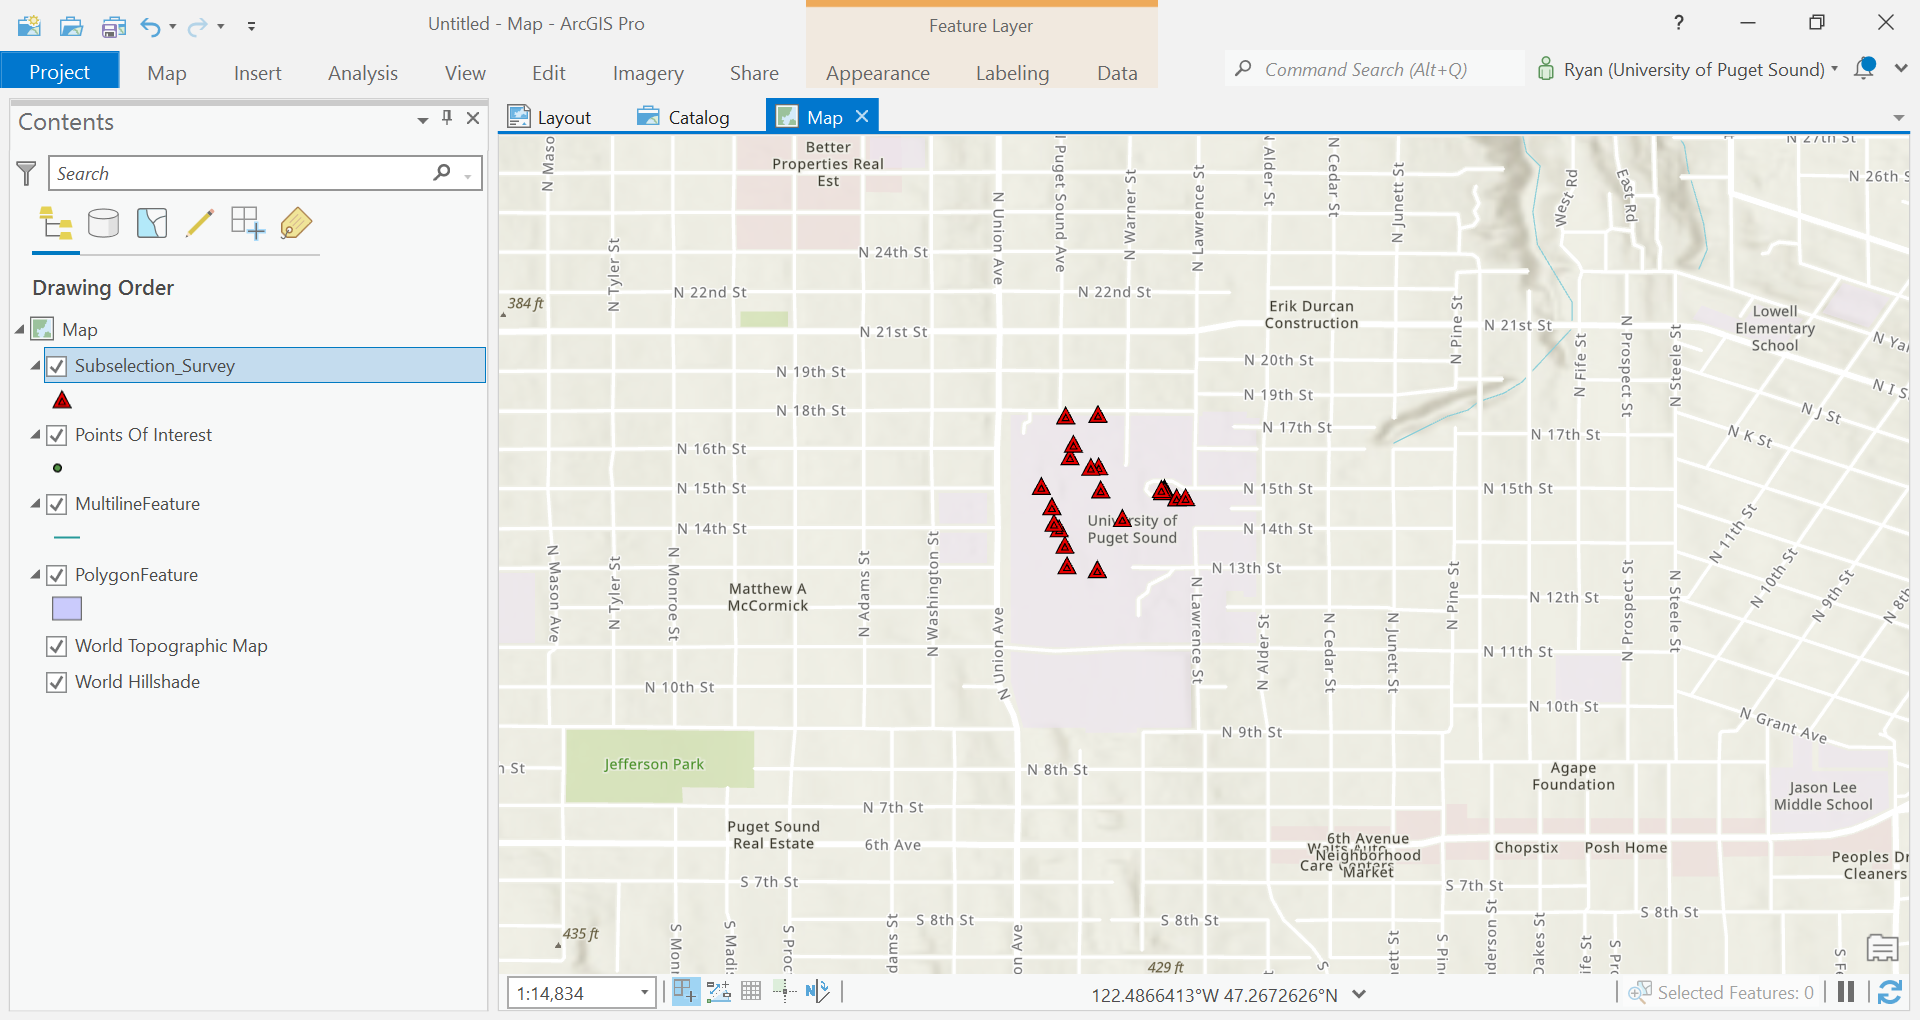
After cleaning up and removing the Survey123 layer, this is what may Map View looks like.
Creating Data
K, now we’re getting somewhere. But now to the hard part…
We now are going to create our own features for each of these three layers we just created.
Edit Tab
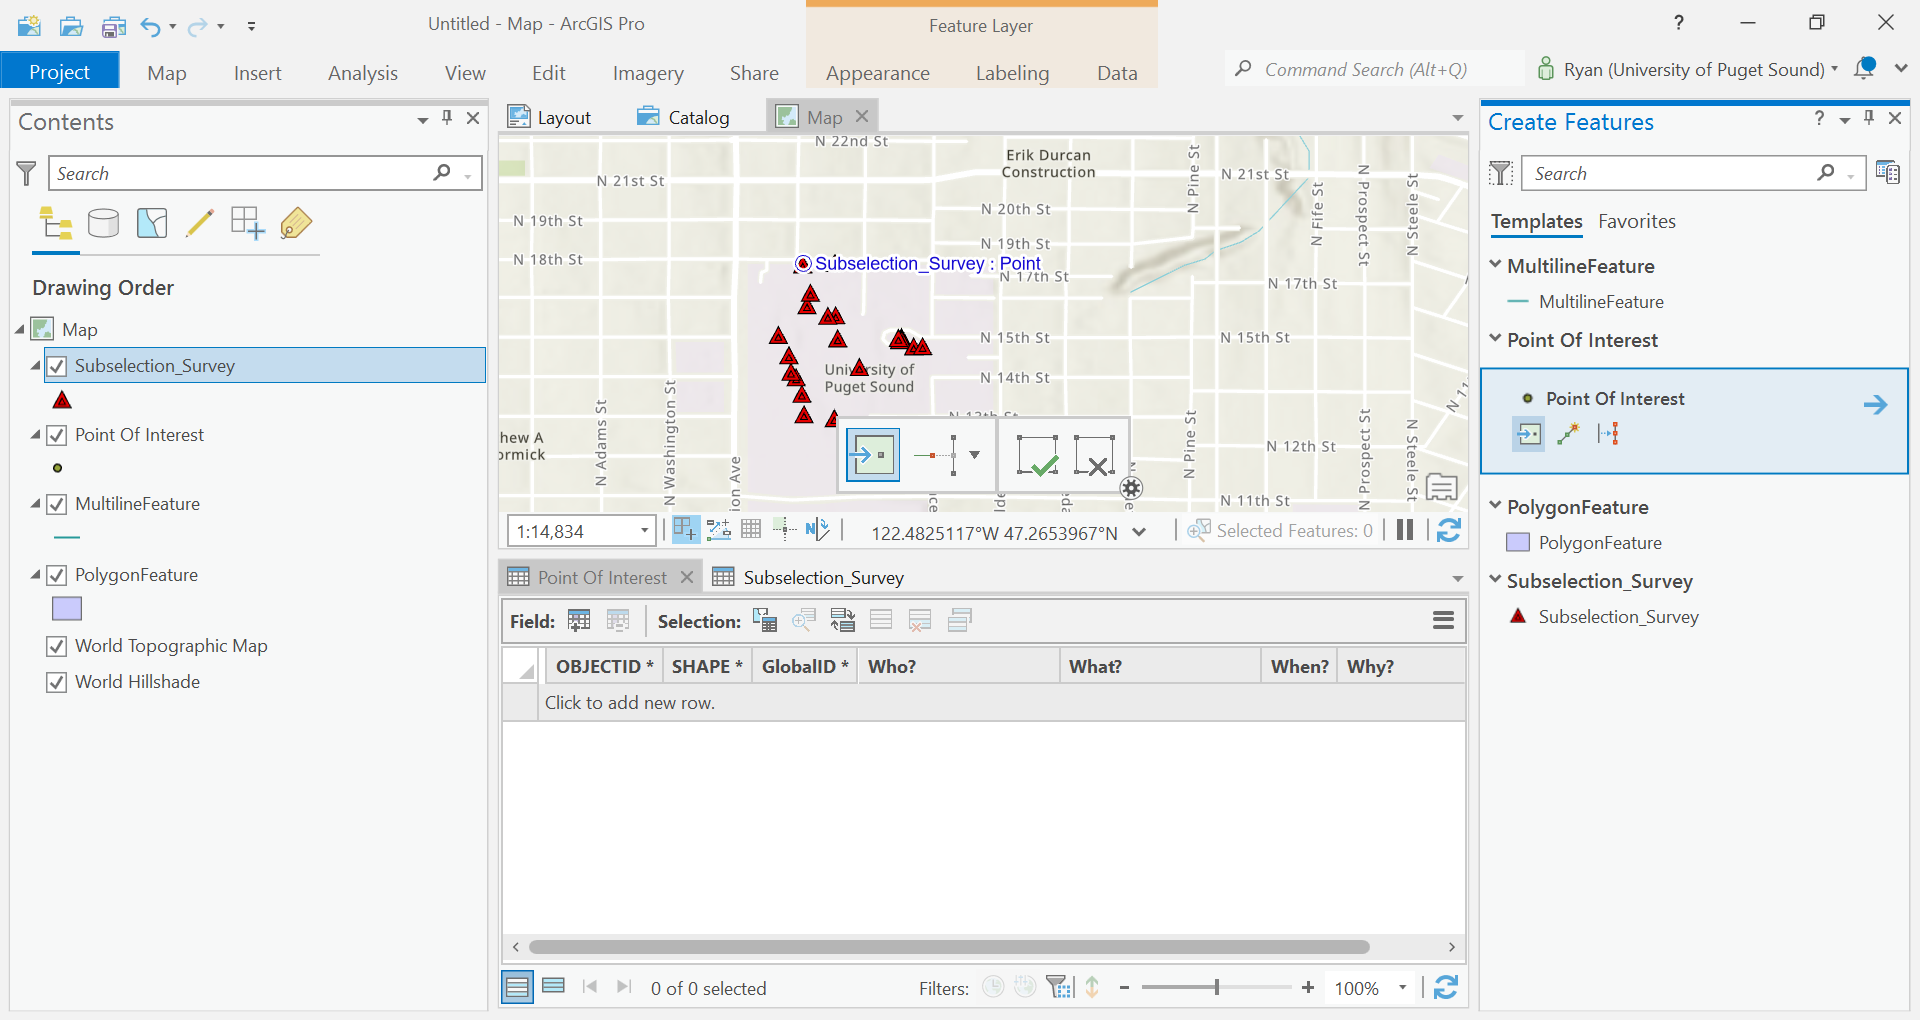
To Edit Features (includes Creating New Features), we will click on our layer in our Map View, Contents Pane, and use the Edit Tab.
We are going to use the Features section and click Create.
This should show a Create Features Pane with the list of items in our Contents Pane.
We will go through each of these layers we created and add copies of our data from our survey accordingly.
Open the attribute table for the feature you are going to create first. You may also want to open the attribute table for your original data.
Click on the layer you want to create.
A window will pop up in the Map View. A tool called snapping should be turned on which will allow you to snap the geometry you are creating to the points in your Survey123 data.
Once you click on the map, a new row should be added to the Attribute Table for that feature.
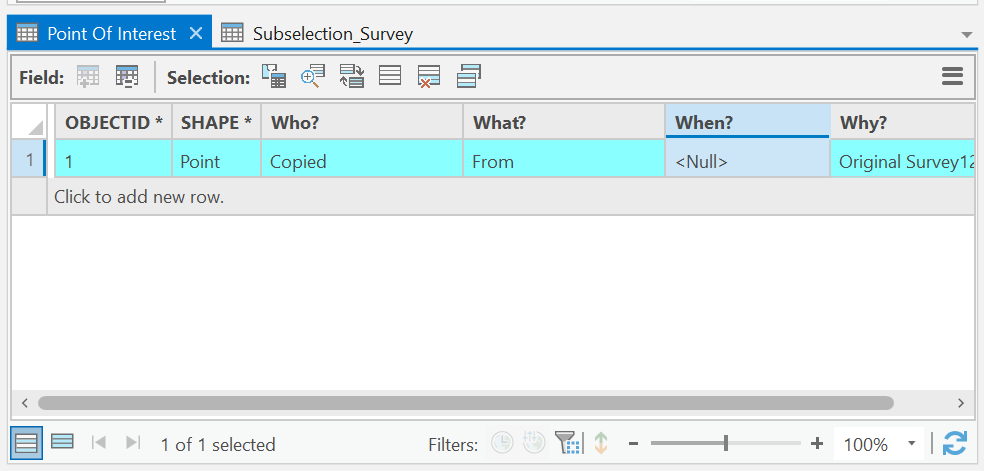
Copy the data from the Survey123 data to the new feature.
When you are first doing this you will want to save your edits after every feature you create. It is very easy to mess up here, so do yourself the favor.
In the Edit tab of the Ribbon, find the Manage Edits section. Click Save if you feel good about your row.
Repeat this process for the other two layers. For each geometry type, there will be a slightly different geometry tool for creating features.
Another hint is to use selections to only show the features you want to copy while you are creating. For example, run a selection to only show the paths points when you are copying your line’s feature layer. Also, don’t forget about how the geometries for lines and polygons is created.
- Line(x1 y1, x2 y2, x3 y3)
- Polygon(x1 y1, x2 y2, x3 y3, x1 y1)
Use the datetime stamp to preserve the order of points when creating your item.
Remember… SAVE OFTEN.
Additionally, choose two of your data layers, and export these features to different file formats. Store them in your project directory, but they will not be in your File Geodatabase.
Explore what these files look like in File Explorer to compare what they look like if you downloaded someone elses ArcGIS Pro Project.
Something like this:
- FileGeodatabase
- FeatureDataset
- Shapefile
- Geopackage/GeoJSON
Take a screenshot of your ArcGIS Pro Project Directory showing all your data files in File Explorer.**
Hint, you will need to see the details of the files, which is configured through the settings in File Explorer.
Final Steps
Our last steps are to create a visally appealing representation of the data that we gathered.
Before we get there, consider if other data could be useful for your map. Search the web for some data file that could add some good context for your map.
Maybe try looking through this data: Tacoma ArcGIS Portal
Symbolize your Data
Let’s work on adding some Symbology for each layer in your Map View.
Just explore here and try messing around with different colors, hues, outlines, strokes, etc.
You’re not getting graded on this, but see what the capablities are.
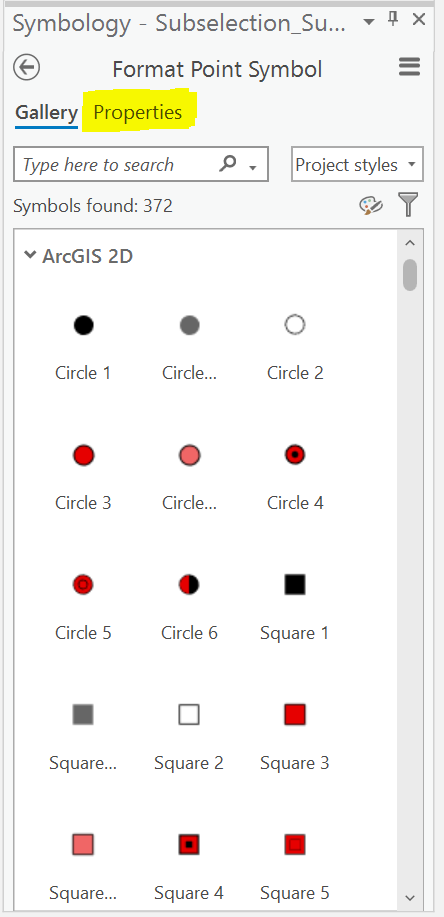
Two different options are again available to you to access the symbology pane.
Right click the layer, and click the Symbology option.
Or, when you click on the layer, view the Appearance Tab in the Ribbon. Click the Symbology Section.
Notice there is a gallery or predefined symbols for you, or if you click on the properties tab, there are options for you to customize the symbol.
Do this for each layer until you feel like it looks good.
Again. Save often!!!
Layout
We are almost done now.
Let’s create a Layout now in which we will display out Map Pane and add any additional map elements to help understand our data.
Once again, there are two different methods of creating a new Layout. Open the Catlog Pane, in the root of the ArcGIS Project, there will be a object Layouts.
Right Click this and click New Layout.
Or, in the Ribbon, Insert Tab, click Insert Layout.
Choose the size of the document (let’s just do Letter for now).
Go back to the Insert tab on the Ribbon, and click Map Frame. Drag the size of the Map Frame that you want in your Layout View. This is the actual size of the map on the paper.
Use some of the examples in Chapter 6 of the text book. Think of what items could add context to your map.
Add a title at least.
SAVE OFTEN!!! I lost my map in writing this DEMO!
Here’s my map.

EXTRA CREDIT (but not really):
- Figure out how to label your features.
- Find a way to embed your images that you took on your map.
Export Your Map
Go to the Share Tab in the Ribbon. In the Output section in the Ribbon, click Export Layout.
Export the map as a JPEG, to your project directory, with 50% Quality and 150 DPI. Click Export and upload this image to the discussion board with a title as Your Base Country vs. Your Comparison Country.
Save your project!
CONGRATS!!! YOU DID IT!!!
Show off all your hard work and post the JPG on the dicussion board.
Every step in this exercise will be used in pretty much every project going forward. These are the basics of GIS!