Economic, Environmental, & Social Benefits of Recreational Trails
In 2020, I contributed to the Hiking and Biking Economic Impact Study, a project commissioned by the Washington State Recreation and Conservation Office (RCO). The study aimed to evaluate the economic contributions of hiking and biking activities in Washington State, providing detailed insights into spending patterns, regional impacts, and recreational trends.
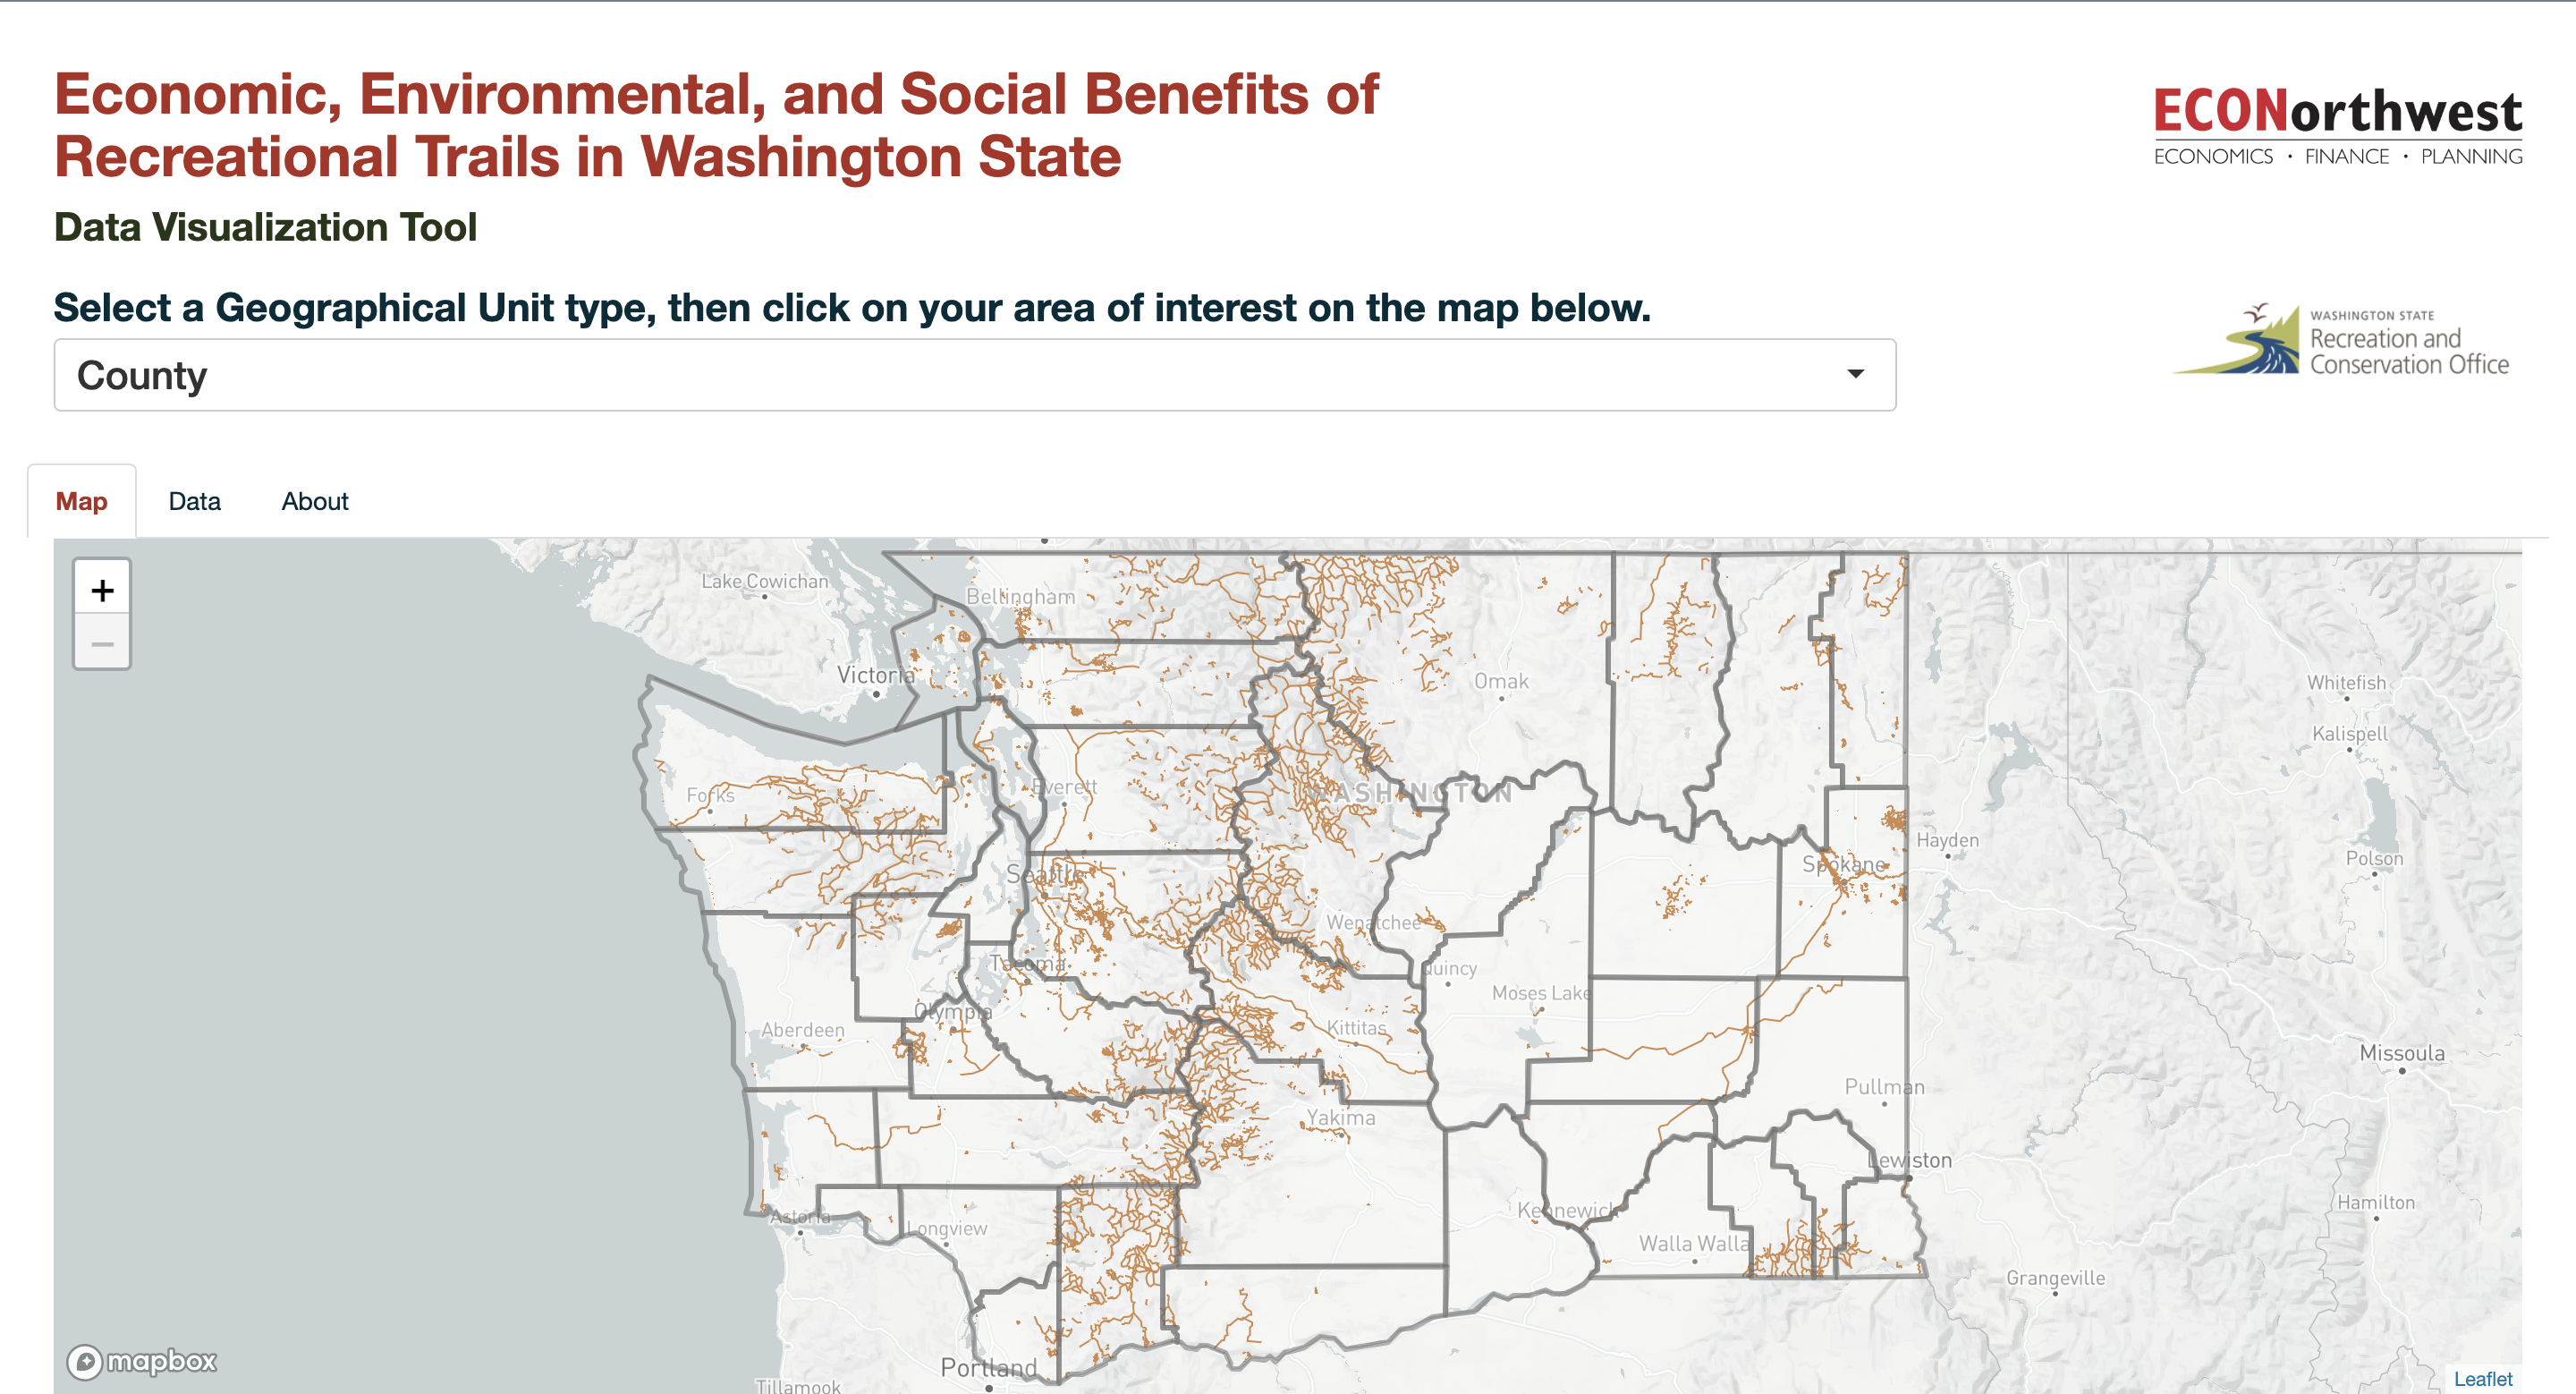
For this project, I developed an interactive web-based tool using Shiny and R to display the study’s results. This tool allowed stakeholders and the public to explore the findings dynamically, offering an intuitive interface to visualize and interact with complex data.
Key Contributions
- Web Application Development: Designed and implemented an interactive Shiny app to showcase study results, enabling users to explore data by activity type, region, and economic metric.
- Data Integration and Visualization: Processed and integrated large datasets to create clear, user-friendly visualizations that communicated the study’s findings effectively.
- Enhancing Accessibility: Ensured the tool was accessible and intuitive for a wide range of users, from policymakers to outdoor enthusiasts, by focusing on usability and responsiveness.
- Collaboration and Delivery: Worked closely with researchers and stakeholders to ensure the tool aligned with the study’s objectives and delivered actionable insights.
Study Outcomes
The study revealed that hiking and biking significantly contribute to Washington State’s economy, driving local spending, supporting jobs, and boosting tourism. The interactive tool I developed provided an engaging way to explore these findings, enhancing their impact and accessibility.
Technical Details and Screenshots
Features of the Shiny App
- Dynamic Filtering: Users could filter results by activity type (hiking or biking), geographic region, and economic indicators such as spending or jobs supported.
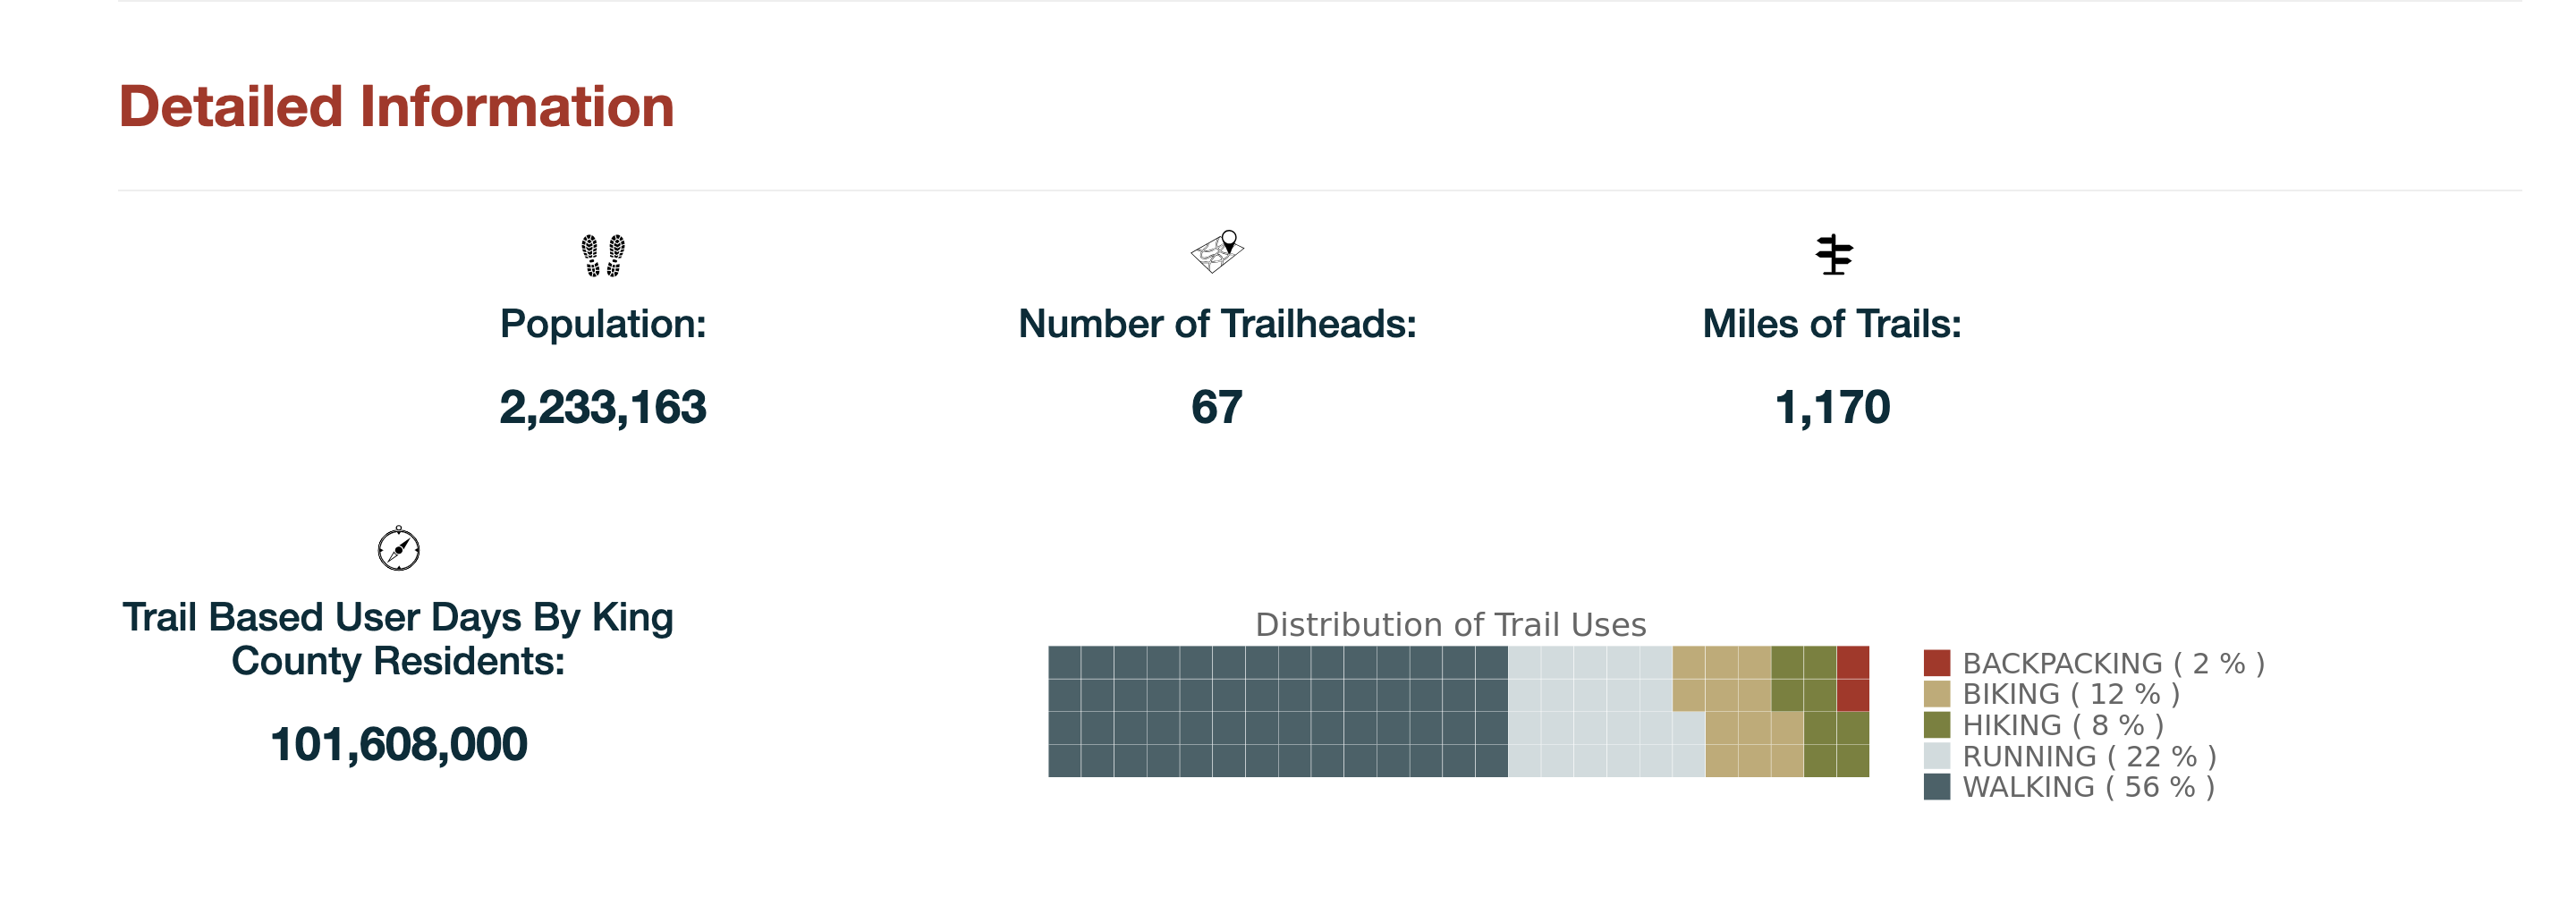
- Interactive Visualizations: The app included bar charts, maps, and tables that updated dynamically based on user selections.
- Responsive Design: Optimized for desktop and mobile users, ensuring accessibility across devices.
Technologies Used
- R and Shiny: For building the interactive web application and handling data processing.
- Leaflet: For creating interactive maps displaying regional data.
- ggplot2: For custom visualizations of economic trends and insights.
Screenshots
Map Dashboard
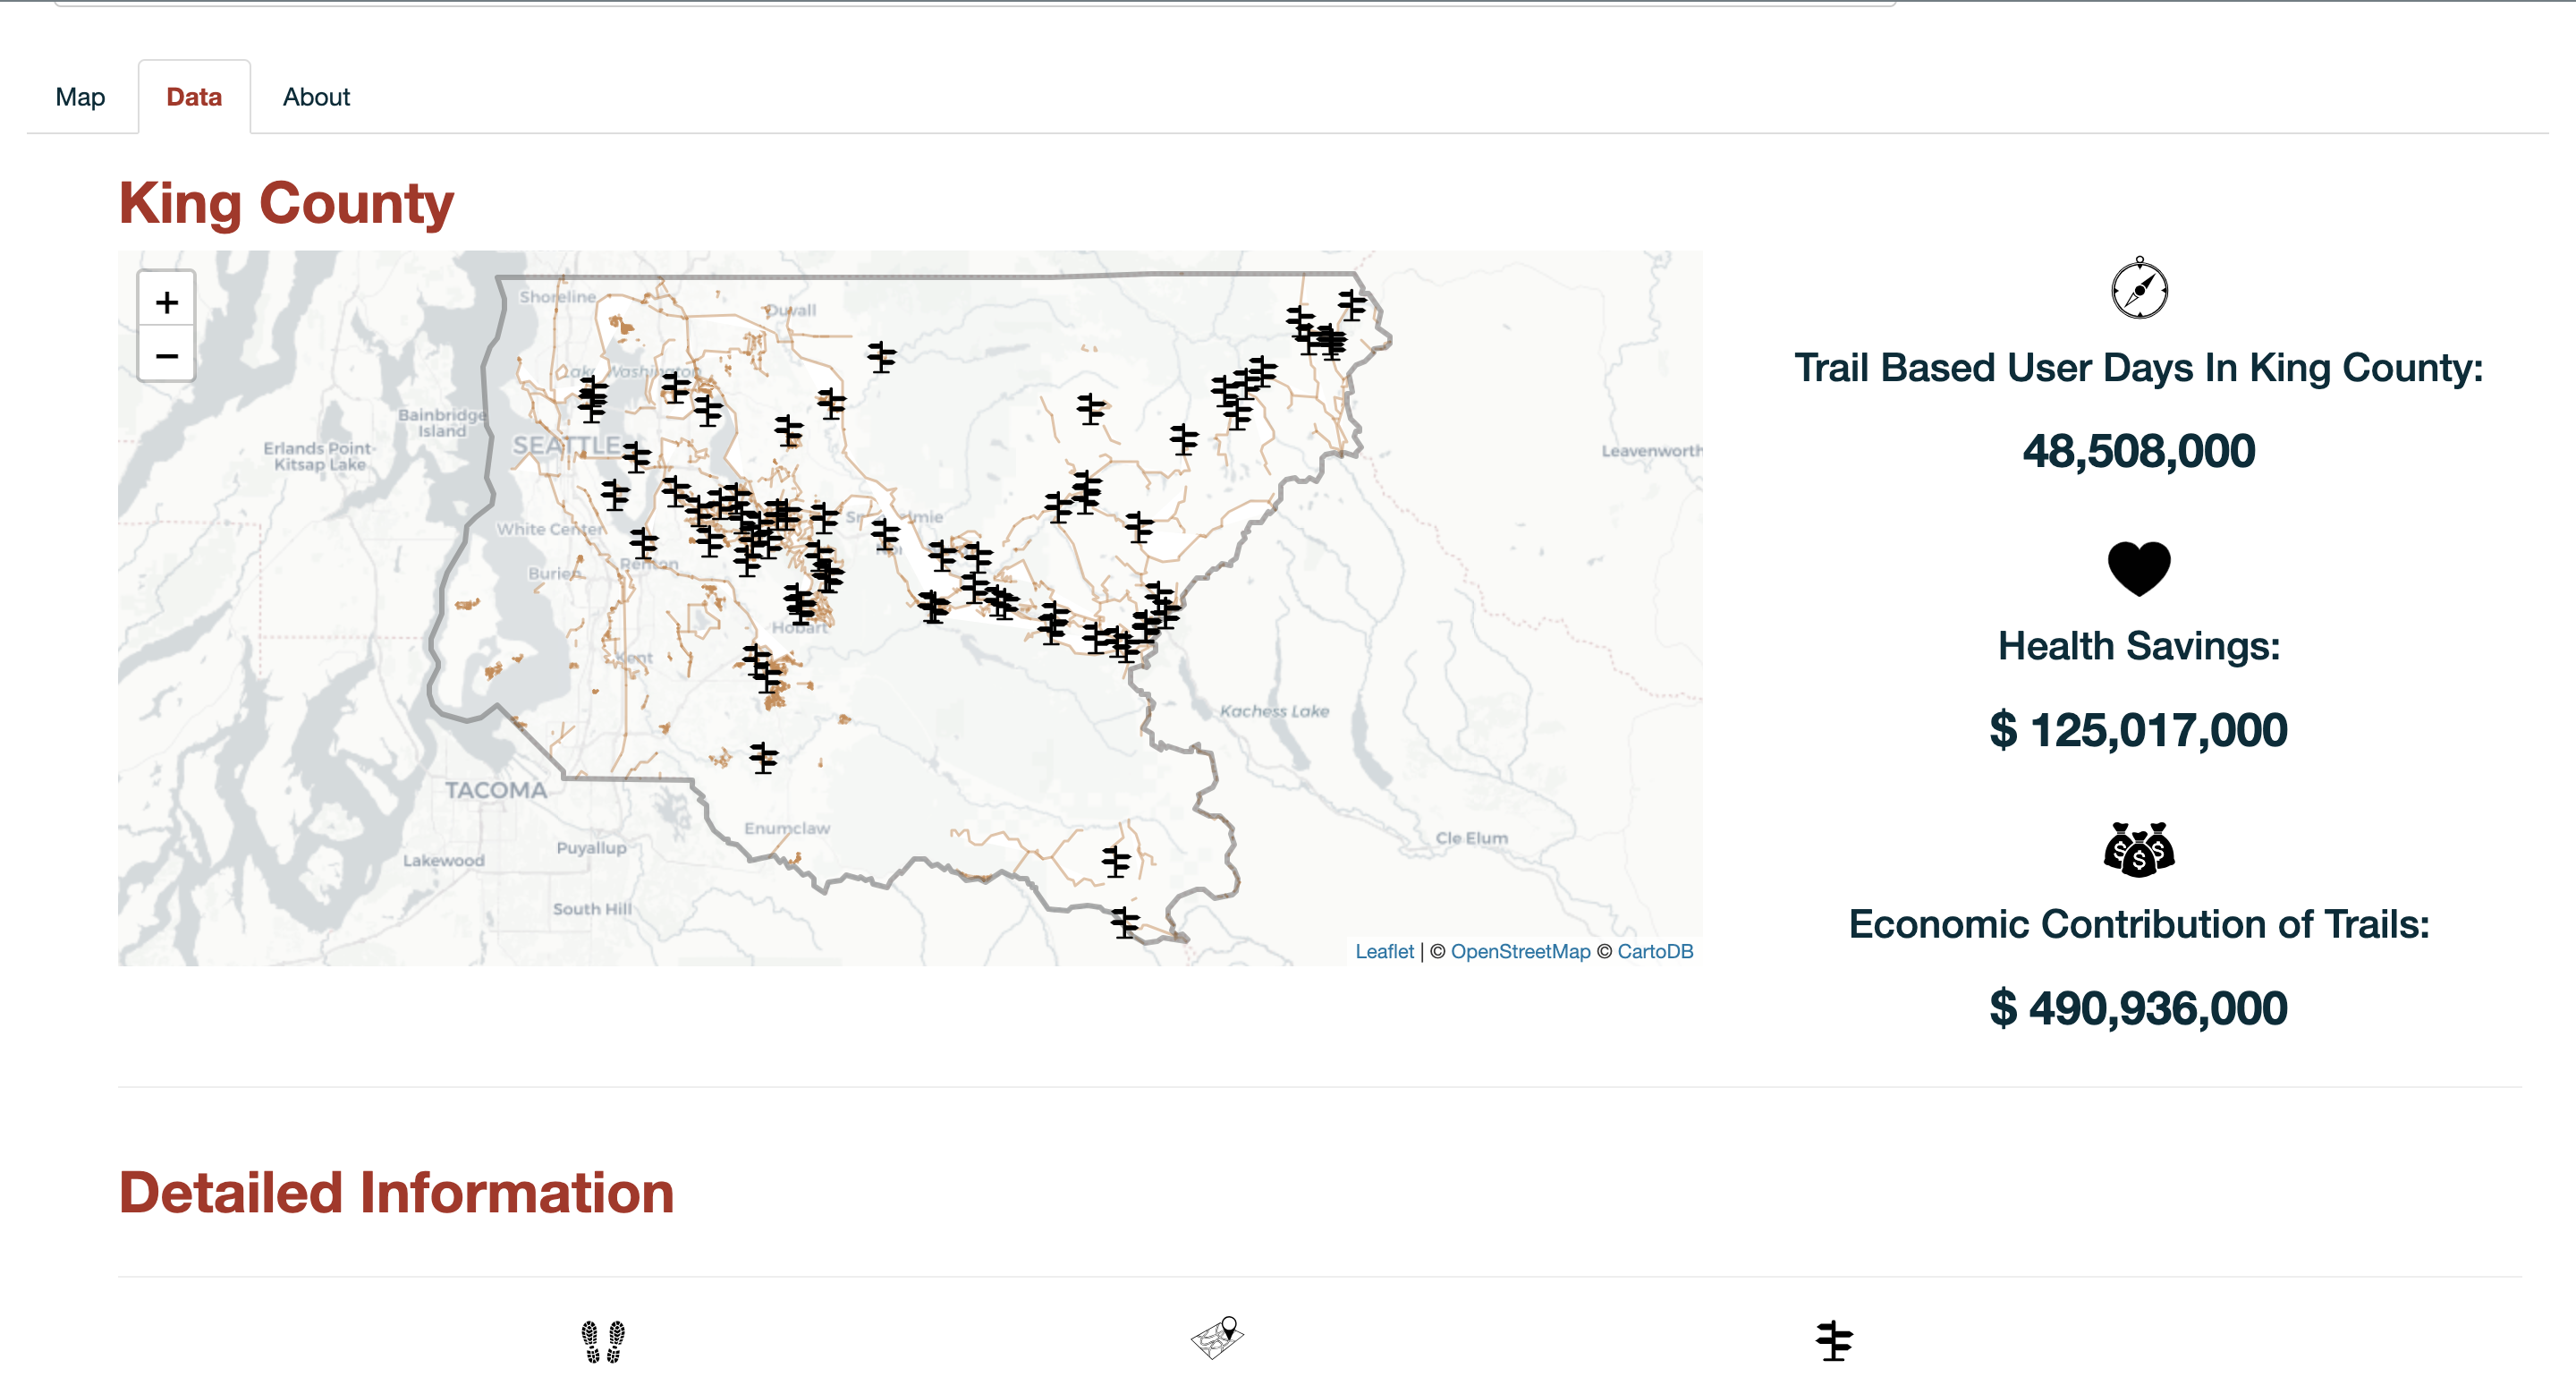
Regional Data View
This project showcases my ability to design and implement web-based tools that make complex datasets accessible and actionable. It also demonstrates my technical expertise in R and Shiny and my commitment to delivering intuitive, user-focused solutions.